Monitoring in PostgreSQL:-
There are two levels of monitoring, this is common for any database and also it is upto your monitoring levels and capabilities.
If you are keeping closely monitoring operating system and database, then adhoc issues wil become less, database will up and runing fine evrey time.
Monitoring will be two levels:-
1) Operating system level
2) Database level
1) Operating system level
1. Number of process : Most of the times if system not responding properly, if it is responding slowly so any DBA first need to monitor process count with irrespective of usernames.
$] ps -ef | wc -l
Then identify postgres user process:-
to filter out sessions from postgres users:-
$] ps -ef| grep postgres|wc -l
Process with root users:-
If you are seeing huge number of processes from root user, inform to OS (Linux) team.
Very less number of processes are there in the operating system including root user and postgres and other users, still seeing slowness then go and check the CPU usage.
Check the CPU utilization by using "top" command.
Query to check query details like username, client_hostname and query :-
postgres=# select pid,usename,client_hostname,query from pg_stat_activity where pid in (1111,2222,3333,4444);
$] uptime ---> execute this command and fine the load average
20:07:50 up 31 min, 2 users, load average: 0.10, 0.07, 0.08
number of CPU --
for example CPU=2,
it won't go beyond 2 i.e. load average
Disk usages:-
$] df -h
===================
pg_archivecleanup :- to delete the old archive files
==================================================
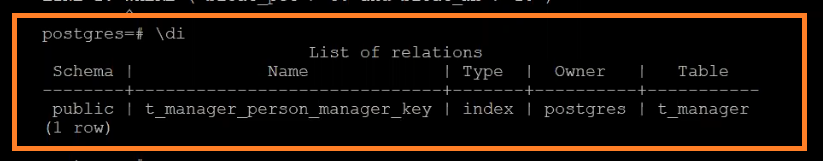
Structure :-


\di --> for checking indexes

Total connections
*************************
select count(*) from pg_stat_actvity;
Active Connections:-
************************
select count(*) from pg_stat_activity where state='active';
Idle connections:-
*************************
select count(*) from pg_stat_activity where state='idle';

select pg_cancel_backend(2794);
select pg_terminate_backend(2794);


pg_catalog.pg_stat_activity
pg_catalog.pg_locks ----> For locking


PostgreSQL parameters:-
deadlock_timeout=300s
statement_timeout=300000 - 5mins
Example:- If any query which is running more than 5 minutes, it will be terminated after 5 minutes


Temp file will be created in base directory (data-directory).
-1 - unlimited is good or bad
-1 -> Unlimited is Bad because it can consume space of data directory and once space is got fulled then application won't be able to connect to Database.
If your Data directory size 100GB, we will assign temp_file_limit 2gb/3gb
If you change any parameter in DB level using alter system command, it will go to postgresql.auto.conf file.


Checking the table statics:-


No comments:
Post a Comment