There are two main types of monitoring in PostgreSQL:
- System resource monitoring: Looks at the infrastructure usage your PostgreSQL runs on, exposing metrics like CPU and memory usage
- Database monitoring: Ensures your database is healthy and running optimally
In both cases, it’s essential to monitor the metrics I’ll discuss below and to look for abnormal behavior. Usually, if one of these metrics is affected, others may be affected too. Monitoring all these metrics will help you with root-cause analysis if abnormalities are detected.
System Resource Monitoring
A healthy operating system running on top of infrastructure is critical for maintaining the stability of your database. System-level monitoring detects resource usage spikes to give you an indication of the future state of your system so you can prevent incidents.
There is a wide range of metrics for monitoring PostgreSQL. Here are a few you should consider when monitoring your system resources.
CPU Usage
You should monitor CPU usage at all times. When your database is running complex queries and doing batch updates, the CPU is hit the hardest. You need to identify when the CPU is approaching its limit and make sure you’re notified if something out of the ordinary is happening in your system. I suggest you start by identifying the typical CPU usage behavior and then setting up alerts if the CPU usage percentage increases to around 85% or more.
Of course, this number can change based on the workloads you run and the number of CPUs you have allocated to the database. If CPU usage hits 100%, your database performance is most likely degrading at an alarming pace. Sometimes, the VM (or whatever system your database is running on) will be unresponsive.
High CPU usage can also be the result of other processes running in your system that are unrelated to your PostgreSQL database, such as systemd processes, http servers, and more. Still, the information gathered from this metric should help you figure out where to start looking to fix the issue.
Memory
Memory and swap usage should be at the top of your list of PostgreSQL metrics to monitor. The reason is simple: If you run out of memory, your database can crash. This means that you should monitor and note your database’s average memory utilization and set up alerts for anomalies, like sudden spikes that reach roughly 85% of memory usage.
Note that there is a difference between used memory and cached memory. You don’t have to account for cached memory because it usually gets freed up when new applications need memory. So even if overall memory usage seems full, you should be covered if a significant chunk is cached/buffered.
High memory usage may be directly related to your database configuration, such as shared_buffers and work_mem, which determine how much memory PostgreSQL can use in your operating system.
Storage
When considering storage, monitoring disk latency should be one of the top priorities. A slow disk means a slow database, and this requires immediate action. Disk read/write latency and disk read/write throughput allow you to see if anything out of the ordinary is happening with your disks. Ideally, lower latency should result in higher throughput.
Disk storage builds up over time, so when your disks are completely filled, you’re out of luck. I recommend setting a warning alert at 85% disk usage and a critical alert at 90% disk usage. But, of course, these numbers can change according to your needs.
It’s a good idea to use Logical Volume Manager (LVM) instead of direct mounts, since this allows you to expand volumes on the Linux system quite easily. Just look at what happened to me when I was working with PostgreSQL. At one point, there were tablespaces mounted to different disks, and the PostgreSQL WAL location was mounted into the OS root file system. This was a clustered PostgreSQL. Unfortunately, there was a network failure, and the PostgreSQL clusters couldn’t keep the sync on. This caused the WAL logs to start piling up.
Can you imagine what would have happened if we hadn’t already set up proper alerts? Disaster! The whole system would’ve gone down. If you don’t want to find yourself in such a situation, set up alerts for all the volume mounts you have on your VMs and make a plan to increase those volumes when the alerts get fired.
Network
Network is another metric that can affect your PostgreSQL database or the applications connected to it. A network failure can be disastrous in a replicating system, resulting in logs filling up your storage. This can even occur when there is high latency between your database servers, if the database is running in clustered mode. This could cause your database to crash with an out-of-space error.
If your application is experiencing network issues and receives an error that the database isn’t available, your network should be one of the first places to look. Bad network configurations and hardware failures can lead to network-level issues.
Database Monitoring
Now that I’ve covered operating-system monitoring, I’ll go over how to monitor PostgreSQL performance and optimize it by collecting database-level metrics.
As you probably know, databases can use a lot of system resources due to poor configuration or inefficient SQL queries. System resource monitoring gives you an indication of when to vertically scale and increase resources to improve database performance. But, more often than not, that’s not what you need. This is where certain database configurations and query optimizations come into play, helping you improve performance without investing in more system resources.
Here are the database-level metrics you should be monitoring.
Query Performance
Certain queries can really hinder database performance. That’s why you need to look for long-running or slow PostgreSQL queries, as well as understand how they are executed and how they affect database performance. Using PostgreSQL’s inbuilt statistic collector, you can extract important information, such as the number of rows fetched, usage of scan vs. index in the query execution, and buffer hits in each query you execute.
There are several metrics that enable database administrators to identify slow-performing queries by singling out those with the highest mean time to execute and maximum time taken to execute. These metrics include Nth latency percentile, number of times executed, maximum/minimum time taken for a given query, and the number of rows affected.
Queries can be slow for many reasons. The most common are bad PostgreSQL configurations, dead tuples, and badly constructed queries with missing indices. One typical way to analyze queries is to run the EXPLAIN command observing the query plan, which enables you to look at how indexes are used and see if you need to change anything in the query.
You can also enable logging with your PostgreSQL configuration. This will log the query execution time for each query in the form of a log, which you can either analyze manually or with a log analysis tool like Sematext or pgBadger (read on for more info).
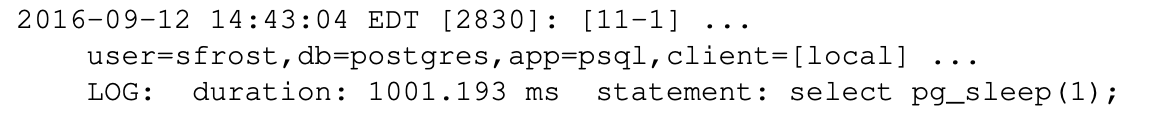
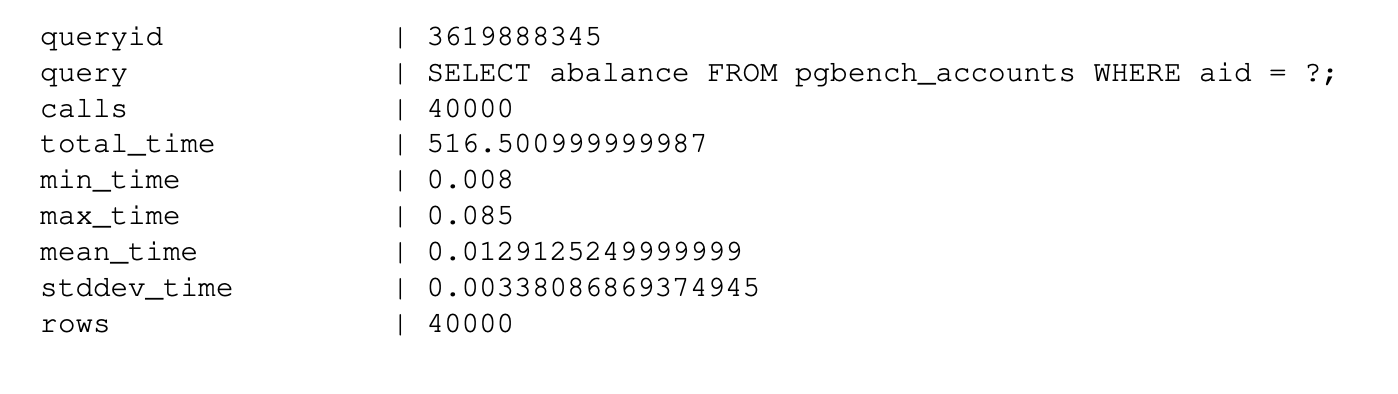
Adding the PostgreSQL extension pg_stat_statements will help you identify long-running queries and the queries that take the most time to execute. It will also show you the number of times each query has been run, the maximum and minimum time taken, and the mean time and number of rows that were affected. You can easily query the stats table to get this information. To achieve the best performance possible, you can then dig deeper to work on query optimization, set up indexes, and so on.
At the end of the day, slow database queries can pose a problem for all associated systems. However, keep in mind that extensions like pg_stat_statements need to be enabled manually and will add additional overhead to your database query performance.
Active Sessions
When applications are connected to databases, they open connections with the databases. These are called active sessions. Databases generally have a maximum number of connections configured by default. For PostgreSQL, it’s 100. You need to monitor these connections and change the parameter max_connections accordingly. Otherwise, your application may scale, but it will eventually fail, since the database will reject the connection request. To avoid this, I recommend creating two alerts: one for 80% of connections used and another to detect anomalies or sudden spikes in the active session count.
Replication
When running production systems, you often need to switch to clustering architectures that ensure high availability. These systems can be active-active or active-passive, and can help with availability and performance by distributing certain workloads among the replicated instances.
For example, in a replicated system, you can use a primary node (master) for data writes and passive nodes (slaves) for running analytical queries and read queries without affecting the performance of the primary node. If an active node fails for some reason, one of the passives can be elected as the master, ensuring database availability. You can easily query replication metrics by accessing the pg_stat_replication table in PostgreSQL. I recommend running PostgreSQL with high availability when you’re running production systems.
Logs
You can derive quite a few metrics from log monitoring and analysis, such as the number of log lines containing warn or error messages. This can give you an early indication that there’s something wrong with the database, which should prompt your DBAs to further analyze the situation and take a look at the logs. This can help you respond to errors thrown by the database before they lead to more serious problems.
From PostgreSQL logs, you can extract metrics like connection_login, which provides information about each connection and disconnection, and log_min_duration_statement, which helps analyze slow queries.

No comments:
Post a Comment